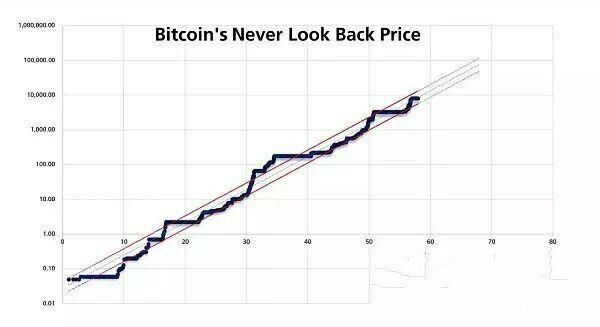
The vertical axis in the figure above is the price of BTC. The transverse axis is the square root of time. The zero point of the horizontal axis is July 19, 2010. The 10 on the horizontal axis is actually the square root of 100, that is, the 100th day since July 19, 2010. 20 is actually the square root of 400, that is, the 400th day since July 19, 2010.
After this line, we see the trend line in the figure jumping up, down a "Never look back" 's price straight. As for the price of the next "Never look back", what the price is, we can't know in advance. But the trend for us is that the price of $3,000 is likely to be hard to hit. From the figure we also found an interesting piece of data: when the trend line goes to the horizontal axis 60, its corresponding price range is between $10,000 (the price of the bottom red line) and $20,000. and the corresponding time is 3600 days after July 19,2010, The time should be between March 2020 and July 2020. That is, if the BTC's never-back price of $10,000 will be reached between March and July next year, it is likely that the $10,000 will be the next never-ending price of the BTC.

A recent article on the foreign network analyzed some of the "never looking back" prices in the history of Bitcoin.The article draws these prices into a chart, showing you a very interesting scene, I would like to share with you.
The square root algorithm of time used in transverse axis is traditionally used to measure the value of time. It simplifies the price change to a straight line form, but does not affect the analysis of price. The two red trend lines in the chart generally reflect the range of BTC prices, that is, the volatility of BTC prices between "never looking back" prices.
At present, the mainstream computing machine on the market is 73T and 68T, the price fluctuates between 20,000 and 30,000, of course, the price of mining machine will fluctuate with the currency, so we have a concept in our hearts. But even if this powerful professional mining tool does not stop, it will take about two or three years to dig out a bitcoin. So if a home computer wants to dig up Bitcoin, don't even think about it. We're still talking with data.
One of the characteristics of Bitcoin network is that it is necessary to compete for the calculation power of the whole network, and the difficulty of computing will be raised with the increase of the computing power of the whole network. Now the calculation power of the whole network has been 600 million times that of the beginning. Maybe college students eight years ago could dig Bitcoin in their dorms with their own computers, so by 13 years professional mining machines will be on the market and home computers will become less and less competitive. And with the popularity of professional mining machines in 16 years, more and more people are involved in Bitcoin mining, the calculation power of Bitcoin network is rising, and the difficulty of calculation is also skyrocketing. Now, not to mention using home computers to dig mines, even a single mining machine. If you do not join the mining pool, it is already very uncompetitive.
The price of``never turning back'' means that after the last BTC fell to a certain price point, no matter how the market develops, it never falls below the price. Whenever you find a``never turn back'' price, record the price with the corresponding time. If we link all the``never turning'' prices in BTC history to date since July 19, 2010, we will see the following price trends.
(picture source:搜狗图片)

From the figure we can see the following phenomena: the "never looking back" price trend of Bitcoin has not changed in the past 10 years, and has been on the rise, and has continued to extend the momentum. Never looking back "prices are difficult to predict in advance, but we find that as the timeline lengthens, the more likely the previously established" never look back "price is.
The price of a horizontal line from axis 34 to 41 is about $200, while the horizontal axis 34 to 41 represents 1160 to 1680 days after July 19, 2010, that is, between September 2013 and February 2015. Once the price of BTC exceeds $200, it never looks back, and with the prolongation of time, the possibility of returning to $200 is almost 0. 5%. Based on this phenomenon, we can speculate on the situation that a low of $3000 in this bear market may face. In this bear market, it reached a low of more than 3000 United States dollars by the end of December 2018. Element, which just corresponds to the last long interval in the graph, that is, a horizontal line corresponding to the transverse axis 52 to 57 in the graph. The corresponding price of this horizontal line is about 3000 dollars. The horizontal axis 52 to 57 represents 2700 to 3250 days after July 19, 2010, between January 2018 and June 2019.


